
Road safety: Landscape of the problem and routes to effective policy advocacy
Editorial note
This report was produced by Rethink Priorities between May and July 2023. The project was commissioned and supported by Open Philanthropy, which does not necessarily endorse our conclusions.
This report builds on a short investigation conducted by Open Philanthropy in 2022, which found that previous philanthropic work on road safety looked potentially cost-effective. This report extends that analysis through in-depth case studies, expert interviews, cost-effectiveness modeling, and research into risk factors, the funding landscape, and promising interventions.
We have tried to flag major sources of uncertainty in the report, and are open to revising our views based on new information or further research.
Key takeaways
Executive Summary
According to the 2019 Global Burden of Disease (GBD) study, there were about 1.2 million deaths due to road injuries in 2019. About 90% of these take place in LMICs, and the majority of those killed are between 15 - 50 years old. Additionally, WHO analysis and expert interviews indicate that road safety laws in many LMICs do not meet best-practice.1 While there is limited information about what risk factors contribute most to the road safety burden, or what laws are most important to pass, the available evidence points to speed on the roads as most risky, followed by drunk driving.
We conducted case studies of key time periods in China and Vietnam to better understand the relative impact of (philanthropically-funded) policy changes versus other factors. Our assessment of China is that we think Bloomberg’s implementing partners contributed minimally to the key drunk driving policy change in 2011, and we think it’s likely that this law was only one of many drivers to reduce burden. In contrast, we think laws were a more important driving force in Vietnam, and advocacy by Bloomberg, the Asia Injury Prevention Foundation and others significantly sped up their introduction. We did not find any sources that gave insight into drivers on a global scale.
Regarding future burden, it’s likely that this will follow trends in motorization. Self-driving cars may mitigate burden as they become more common; one source estimates they could constitute 20% of the global market by 2040, though we expect this to be lower in LMICs.
This report builds on a short unpublished investigation conducted by Open Philanthropy in 2022. A quick BOTEC from that report, based on an existing impact evaluation (Hendrie et al., 2021), suggested that Bloomberg’s road safety initiative might be quite cost-effective (ROI: ~1,100x). This report extends that analysis by reviewing Hendrie et al.’s estimates of lives saved, and comparing the authors’ estimates for China and Vietnam to data on road outcomes from multiple sources. For China, we found that while the data shows reduced fatalities after 2011, we could not link them specifically to fewer incidents of drunk driving. For Vietnam, quantitative evidence for the impact of the helmet laws was stronger than for the drunk driving laws. As can be seen in our BOTEC, this analysis led us to reduce the estimated effectiveness of policy changes by 40% - 80%.
In addition, we used our case studies to estimate specific speed up parameters for advocacy of 0.4 years in China and 3.8 years in Vietnam, versus the 10 years used previously. These changes significantly reduce our estimate of lives saved to 17% of Open Philanthropy’s previous estimate. If we use the same methodology as the previous estimate (i.e., divide this estimate by 259 million USD, the entirety of Bloomberg’s spending between 2007 - 2020), then the ROI drops to 148x. However, we propose to account for the risk of failure in a different way. If we take an estimate of relevant philanthropic spending on advocacy in China and Vietnam only (~6 million USD) and apply a “risk of failure” parameter to generalize from these successful cases to all potential advocacy, then our calculated ROI is 1,544x (corresponding to about $65 per DALY averted).
The experts we spoke to suggest that laws can change as a comprehensive package (when the existing law is very old), or as amendments that tackle one (or perhaps two) risk factors. They suggested that countries do learn from one another, through networks like ASEAN, but some experts seemed to suggest that most spillover happens when NGOs actively transplant successful campaigns or projects from one country to the next.
Regarding other, non-legislative road safety interventions, we highlight three possibilities that could be worth further research: advanced vehicle technologies, medians, and integrated transport systems.
We think it’s likely that cost-effective opportunities in road safety legislation remain. While multilateral development banks (MDBs) spend $0.7 billion - $1 billion per year on road safety, this seems to be primarily focused on assessing and building safer roads, and providing institutional support to governments (e.g., setting up crash data systems). Philanthropic funding is more limited, with Bloomberg spending 40 million USD per year, and a brief review of other organizations suggests annual funding from other sources is in the region of 25 million USD. Bloomberg’s focus on 10 countries (and primarily urban settings) means gaps remain elsewhere, and these aren’t being completely covered by other foundations or the United Nations, in part due to funding constraints.
Specifically, we think there are opportunities for grantmakers to support advocacy for better speeding legislation in Pakistan and Thailand (where urban speed limits are 80 - 90 km/h). Additionally, there may be scope for grantmaking to advocate for better enforcement of laws in Indonesia and Nigeria. None of these countries are currently supported by Bloomberg’s road safety program.
Why could this area be promising for grantmakers
- We think this topic is neglected: There are clear gaps between laws in LMICs and best practice, and legislative advocacy seems neglected in some places despite large amounts of funding for other elements of road safety (e.g., building roads).
- Our BOTEC suggests that advocacy is cost-effective enough to consider grantmaking.
- Our case study of Vietnam suggests advocacy can have an impact on this topic, and technical assistance provided by advocates can improve laws.
Why might grantmakers not want to fund this?
- The quality of the data on road outcomes seems limited. This has two
implications:
- Our data deep dives were not conclusive about the impact of previous policy changes, even though Blair Turner (a consultant for the Global Road Safety Facility) suggested that crash and fatality data for Vietnam and China is generally perceived as good quality compared to other LMICs. This makes us less confident about the effectiveness of these laws.2
- Poorer data quality means that tracking the impact of any grantmaking is likely to be difficult. Xiaojing Wang (Vital Strategies) also flagged that in some countries, the road safety data is considered sensitive and therefore difficult to access.
- There are reasons why Bloomberg is not working in some countries (e.g., security concerns, lack of legislative process), and trying to work in the gaps may lead grantmakers to fund opportunities that look promising but are actually intractable. While we’ve included what we know about Bloomberg’s choices not to fund some countries (e.g., Nigeria, Morocco) in our report, further insight may be hard to get.
Key uncertainties
- We highlight that speed is the most important factor to address to reduce
the burden of injuries and deaths on the road, and therefore may have a higher
ROI than our BOTEC indicates (as this is based on only drunk driving and
motorcyclist protection). However, it may be that legislation to stop speeding
is also more difficult to advocate for and introduce.
- This might be suggested by the fact that Bloomberg’s previous three phases have had limited success in passing effective laws for speeding.
- In contrast, Charity Entrepreneurship’s 2022 report on road safety reviews 84 cases of advocacy for road safety legislation, and estimates a 48% success rate across all kinds of risk factors. If we re-calculate for the subset of cases related to speeding, this suggests a 77% success rate. We don’t suggest updating too much based on these numbers (as we don’t know that the case selection is representative), but they suggest speeding might not be so different from other laws.
- Our approach to the BOTEC was informed by previous OP work that relied on Hendrie et al. (2021). As a result, we selected
cases that were relevant to Hendrie et al. (2021), but we think there are open
questions about how much these legislative changes in China/Vietnam 10+ years
ago reflect opportunities that grantmakers might consider for grantmaking now. Our “risk
of failure” parameter tries to adjust for this, but it is ultimately a crude way
to do this.
- Our “risk of failure” parameter currently implies that about one in every four philanthropic attempts to change road safety policy succeeds. If we had more time to refine our estimate, we might more closely investigate the characteristics of Charity Entrepreneurship’s sample, and the extent to which a success in that sample is comparable to the successes in China and Vietnam which we review in this report.
Experts interviewed3
- Nneka Henry - Head of United Nations Road Safety Fund
- Blair Turner - Senior Road Safety Specialist, consultant for the Global Road Safety Facility (GRSF) at the World Bank
- Atsani Ariobowo - Manager, Global Road Safety Partnership
- Kim Lua - Program Officer, Global Road Safety Projects & former Senior Associate at World Resources Institute China (2015-2019)
- Lulu Xue - Urban Mobility Manager, World Resources Institute, China Ross Center for Sustainable Cities
- Xiaojing Wang, Deputy Director of Road Safety, Vital Strategies
- AIPF Vietnam:
- Jimmy Tang - Chief of Staff
- Phong Le - Vietnam country manager
Overview of the problem
Importance of the problem
According to the 2019 GBD study, there were about 1.2 million deaths due to road injuries in 2019, which was about 2.1% of all deaths in 2019. The GBD attributes about 73 million DALYs to road injuries in 2019, representing about 2.9% of the global DALY burden.
The total number of road traffic deaths has been relatively stable over time, ranging between ~1.1 million and ~1.3 million deaths over the past 30 years. Within that range, the number of deaths increased to a peak of 1.29 million in 2008, fell to 1.20 million in 2015, then stabilized.
Figure 1: Global road traffic deaths, 1990 to 2019. From Our World in Data (2023).
The trends in the number of road injury DALYs, as estimated by the GBD, closely track the trends in the number of deaths.
Note that estimates from the WHO’s Global Health Observatory (GHO) show a different trend from the GBD’s estimates: according to the GHO, the number of road traffic deaths continued to rise after 2008 and, as of the latest data in 2019, is at an all-time high of 1.28 million.
Breakdown by road user type
Globally, in 2019, about 37.6% of people who died due to road accidents were pedestrians; 37.5% were drivers or passengers in cars; 18.6% were motorcyclists; and 5.4% were cyclists (Our World in Data, 2023).
Geographic breakdown
Approximately 89% (GBD, 2023) - 92% (WHO, 2023) of road traffic deaths take place in LMICs. Just over half of road traffic deaths take place in Asia.
The highest per-capita rates of road traffic deaths are found in Africa and the Middle East. The ten countries with the highest rates of road traffic deaths are Saudi Arabia, Central African Republic, Oman, Lesotho, United Arab Emirates, Yemen, Eswatini, South Africa, the DRC, and Libya (GBD, 2023). These countries have road traffic death rates of between 30 and 60 per 100,000 population, while the global rate is about 15 per 100,000.
The countries with the highest absolute burden of road traffic deaths are China, India, Brazil, the USA, Indonesia, the DRC, Egypt, Vietnam, Saudi Arabia, and Iran (GBD, 2023).
Demographic breakdown
About 75% of the people who die due to road accidents are male (GBD, 2023; WHO, 2023). According to GBD estimates, the majority of people who die due to road accidents are between the ages of 15 and 50.
| Age range (years) | Percent of global burden of road traffic deaths |
| 0-14 | 7.8% |
| 15-49 | 54.3% |
| 50-69 | 25.5% |
| 70+ | 12.4% |
Table 1: Burden of road traffic deaths by age group. Data from GBD (2023).
There is limited information about the breakdown of behavioral risk factors, but sources point to the importance of speeding, then alcohol
We spent one day looking into the risk attributable fractions (RAF)/breakdown of the five key risk factors for road traffic accidents (RTAs): speed, drunk driving, helmets, child restraints, and seat belts.4
Based on this brief review, we believe that speed is the most important factor, followed by alcohol. Our conclusion is based on:
- Chisholm et al. (2012) is the only source we found that includes all five factors and attributes risk to each.5 As shown below, the paper indicates the importance of speeding, and then alcohol.6 It also suggests that more than half of accidents have another cause.
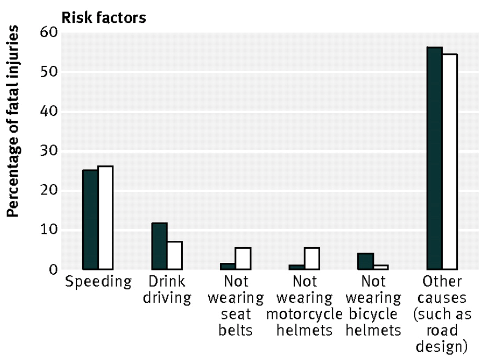
Figure 2 : Percentage of fatal injuries by risk factor, for sub-Saharan Africa (black) and South East Asia (white). From Chisholm et al. (2012) .
- Other papers that compare speeding and alcohol tend to find the risks of speeding to be larger than drunk driving, e.g., a regression analysis of 13,000 fatal crashes in South Africa (Govender et al., 2021), and an analysis of self-reported behaviors and crashes in France (Constant et al., 2011).
- Blair Turner (GRSF) confirmed that he thinks speeding is the most important risk factor – referring to going above the speed limits, or driving too fast for conditions. He mentioned that he thinks official estimates of around 30% are on the low side, and personally estimated it to account for around half the road trauma deaths.
This suggests that policies that target speed and drunk driving may be the most impactful to pursue.
Philanthropically backed legislation likely drove significant reductions in Vietnam, but for China, policy change was one of many contributing factors
As mentioned above, the global burden of RTAs fell between 2008 to 2015 before stabilizing. Some of the improvement may be attributable to philanthropically-funded advocacy for policy change related to key risk factors, but other contributing factors could include a) non-policy factors – such as improving road and vehicle standards, or behavioral/cultural change independent of policy – and b) legislative change not driven by philanthropy.
To try and disentangle the potential contributing factors to recent improvements, we initially considered a quantitative exercise as outlined in the brief. This would have involved plotting the trend in road safety burden for countries that did receive Bloomberg funding versus those that did not. However, we ultimately decided against this due to concerns about data quality, and the expectation that we would have considerable uncertainty about any results due to an inability to control for other relevant factors.
As a result, we adopted a case study approach.7 We selected China and Vietnam for this exercise, as a recent evaluation of Bloomberg’s road safety program (discussed further here) attributes 51% of all expected lives saved on the roads by Bloomberg and its implementing partners between 2007 - 2030 to policy changes in these countries in 2007 - 2014.8 In this section, we provide an assessment of whether we think advocacy contributed to these changes; in the following section (here) we investigate what impact those policies had.
China: We’re skeptical that philanthropy sped up policy changes in 2011, though it’s possible WHO input improved the legislation
The key legislative change in 2011 was an amendment to the Road Traffic Safety Law that significantly increased fines for drunk driving,9 criminalized driving with a blood alcohol concentration (BAC) above a certain limit,10 and increased the length of time for driving license suspensions. This change took place while China was part of a Bloomberg Philanthropies initiative that began in 2010, and an impact evaluation of the Bloomberg program (see more below) includes lives saved from this legislative change within its scope.
However, there is evidence of sustained governmental activity on drunk driving in the years leading up to this amendment, including before the first Bloomberg phase in China (2010 - 2014). In 2009, the Supreme Court “announced that drivers who cause serious injuries and deaths after drinking and driving and/or hit and run crashes will be convicted and punished” (Li et al., 2012, p. 103). The Ministry of Public Security also organized “intensive enforcement campaigns” on drunk driving at the end of the year, engaging seven million police in the activity and increasing prosecutions by 40% (Li et al., 2012, p. 105).11 In December 2009, the government enacted a new order to punish drunk drivers with points deductions on their license and send them to a seven-day road safety training program (Jia, 2015, p. 39). This change, implemented in April 2010, was followed in February 2011 by an amendment to China’s Criminal Law which “stipulated that all drunk driving cases must be considered as criminal offenses, whereas the previous law imposed criminal penalties on drunk drivers only when they caused serious traffic accidents” (Jia, 2015, p. 41). This last change seems to have paved the way for the key amendment to the Road Traffic Safety Law in May 2011.
Although drunk driving was one of the focuses of Bloomberg-funded work in China between 2010 and 2014 (alongside speeding), given the timeline of events, it seems unlikely that they caused the legislative amendment in early 2011.12 However, it’s possible that implementing partners affected the change in other ways before 2011.13 Xiaojing Wang, Deputy Director of Road Safety at Vital Strategies, shared that the lead implementing partner of Bloomberg’s work for 2010 - 2014 was the WHO. She believes it’s likely that the WHO, upon hearing that China was working to strengthen drunk driving laws, would have approached the relevant national agency to see if they could offer support.14 However, as she was not directly involved, we remain uncertain about whether this happened, and to what extent any WHO support improved the resulting legislation.
Wang et al. (2019) describe other developments in China at the time that could also have contributed to reducing the burden of road traffic accidents: significant investments in the transport network, government-funded road safety education efforts, and increasing use of trains (versus buses).15 Road quality improved between 2011 - 2015.16 Bardhan (2015) suggests that Chinese vehicle standards were also being strengthened. Xiaojing Wang also highlighted that a government crackdown on corruption, which included the issue of drinking alcohol at state events, may have contributed. While we were not able to find any source that describes the relative impact of each factor on road safety, our takeaway is that we should likely consider the drunk driving law to be one of many factors that influenced any decreases in China.
Vietnam: We believe that Bloomberg and other philanthropies have contributed to more effective Road Safety policies through a mix of advocacy and technical assistance
We have used a case study by the Asia Injury Prevention Foundation (AIPF)17 and a Safety Performance Review by the United Nations (2018) to assess the impact of philanthropic spending on road safety in Vietnam, in particular by Bloomberg. We also interviewed Jimmy Tang and Phong Le from the AIPF.
Our sense from our case study below is that Bloomberg and the AIPF have contributed to more effective road safety policies in Vietnam through advocacy and technical assistance.
Road safety law changes before 2008 were largely ineffective in Vietnam
Vietnam has been actively addressing road safety concerns. As described in the Road Safety Performance Review by the United Nations (2018), Vietnam established a National Traffic Safety Committee in 1997 and passed the first road safety law in 2001 as a response from the government to a sharp increase in road casualties.18 However, “[d]ue to the poor preparation of these documents, the regulations only required motorbike and motorcycle drivers to wear helmets on non-urban roads, so this policy was largely unsuccessful” (p.28).
The law was updated in 2007/2008,19 2011, and 2016, solving issues with implementation and creating stricter rules for helmet wearing, speeding, and drink driving among others (p.20, p.28). In Appendix A, we explain the history of Vietnam's road safety legislation in more detail.
We believe that Bloomberg and the AIPF have contributed to more effective road safety policies in Vietnam through a mix of advocacy and technical assistance
Vietnam has received funding for road safety from different organizations. The AIP Foundation has been involved in Vietnam since 1999, focusing mainly on helmet wearing (Goldman, 2018). Bloomberg selected Vietnam as one of its three pilot countries when beginning its road safety program in 2007, and continued in 2010 as part of the RS10 Road Safety Programme funded through GRSP. This was partly implemented by the AIP Foundation. The country also received a $9.1 million loan from the World Bank for road projects.20
The AIPF facilitated a workshop on road safety with ministries, nonprofits, and the private sector, which was a starting point of the universal helmet law, together with GRSP and the French Red Cross (Goldman, 2018, p.35). In 2006, the AIPF and GRSP supported the Vietnamese government in the development of a Helmet Action Plan, which encompassed a plan to enable enforcement of the new upcoming road safety law. The AIPF also initiated a large campaign around the new law, which was supported by Bloomberg, amongst others (ibid., p.37), and which contributed to the success of the law (CGD, 2015). According to the AIPF, adult helmet use rates on motorcycles increased from 6% in 2007 to 96% in 2008 (Goldman, 2018, p.45).
It seems likely that the AIPF and Bloomberg have contributed to well-crafted legislation and the subsequent translation into policies21 in collaboration with different parts of the Vietnamese government, contributing to the successful policy change of increasing helmet use.
We found that there was less literature available describing the role of philanthropy in passing new drunk driving legislation in 2008 and increasing penalties for drunk driving in the following years. Speaking to the AIP Foundation, they suggest that this can be attributed to less policy action and philanthropic involvement on the issue of drunk driving compared to helmet advocacy during this period.
There are also other ways in which AIPF and Bloomberg have worked on road safety in Vietnam. For example, AIPF developed a school program educating children on the importance of helmet wearing, and distributing helmets to children (Goldman, 2018, p. 29) and opened a local factory to create helmets that were more suitable for the Vietnamese climate (p.26).22 In our interview, Phong Le from the AIPF shared many more examples across all five risk factors, such as a school zone safety program that they have been working on with GRSP since 2018. An example related to drunk driving is that Bloomberg pilotted checkpoint breath testing (United Nations, 2018, p.95). They applied international best practices so that drivers could be tested for drunk driving in two minutes, down from 20 minutes. This method of breath testing became the official procedure in all provinces in 2014.
We investigated whether other, non-policy factors were likely contributors to road safety during this time. Ngoc et al. (2022) attempt to quantify the impact of various policy changes on road fatalities in 1990-2019 while also controlling for development23 and vehicle ownership. Their findings suggest that the helmet laws reduced fatalities by 8.5% - 14% per year, beyond the impact of development. They do not find a significant effect for the drunk driving law, but we think this may be in part due to a methodological difference.24 Phung et al. (2020) also find that the helmet law was impactful beyond socioeconomic factors, with the effect being greater in provinces with higher literacy rates.
Beyond these papers, we spent roughly an hour looking into other potential contributing factors. A report from the United Nations (2018) suggests that infrastructure improvements between 2008 and 2018, particularly building expressways, contributed to a reduction in road casualties (p. 14). If we look at the World Economic Forum’s Global Competitiveness Index, this suggests that the quality of Vietnam’s roads did improve between 2008 - 2015, but the change does not seem so great as to explain away other contributing factors.25 We’re unsure as to the extent that vehicles – particularly motorcycles – became safer over this time period.26 Altogether, we think it’s more likely that policy changes have been a driving force of change in Vietnam than in China.
Burden in LMICs is likely to grow with increasing motorization, but the rate may slow in the second half of this century if self-driving cars become common
According to Blair Turner, a consultant for the World Bank’s Global Road Safety Facility, there are no reliable sources that project the expected future burden of road safety. Given his expertise, we did not spend time looking for projections of the burden. Instead, we briefly searched for projections of motorization, since Turner expects that the per capita burden of road safety will rise as motorization rates rise in LMICs.
The International Organization of Motor Vehicle Manufacturers (2020) writes that motorization rates in Africa have grown by 4%, and those in Asia, Oceania, and the Middle East by 8% between 2015 and 2020. They do not give future forecasts and we have not seen their methodology. A report by the Freedonia Group suggests further growth in Asia by 2031, as shown in Figure 3 below. Since the limiting factor for this topic is not the scale, but rather tractability or neglectedness, we limited our search to 20 minutes.

Figure 3 : Global motor vehicle park by region. From Global Motor Vehicle Outlook, Freedonia group (2023) .
Autonomous vehicles will likely have a large impact on road safety,27 but only once they become relatively common. According to Litman (2023), this could be between 2040 and 2060 (p.1). As shown in Figure 4 below, they predict that the percentage of autonomous vehicles on the road will be about 20% in 2040 and 50-60% in 2060. We understand these to be global figures, and expect that the uptake will be slower in LMICs because the fleet there typically consists of cheaper cars, and secondhand cars from other parts of the world.

Figure 4 : Prediction of autonomous vehicle trends. From Litman (2023) .
We consider autonomous vehicles out of scope for the rest of this brief, and have only very briefly skimmed the methodology of the paper above (which seems quite basic at first glance). However, this does present an update to the previous OP work in 2022, and may be worth considering in further research into road safety.
Effectiveness of existing Bloomberg Philanthropies work
Our BOTEC builds on an existing Bloomberg-funded impact evaluation and previous work conducted by Open Philanthropy
Hendrie et al. (2021) is a Bloomberg-commissioned impact evaluation of Bloomberg-funded road safety initiatives implemented between 2007 and 2018. The article estimates impact in terms of lives saved. In 2022, an Open Philanthropy researcher used the authors’ estimates to construct a quick BOTEC that suggested that Bloomberg’s road safety initiative might be cost-effective enough for Open Philanthropy to want to buy retrospectively (ROI: ~1,100x).
For this report, we built on previous efforts by reviewing how Hendrie et al. (2021) estimate lives saved. We also investigated whether road fatality data from Vietnam and China reflected the authors’ estimates of the impact due to Bloomberg-attributed legislative changes.
Hendrie et al.’s estimated impact of road safety policies seems slightly optimistic versus other evidence
Our detailed write-up of the analysis can be found in Appendix B, but in summary, we believe that Hendrie et al.’s estimate that on average 4.5% of road fatalities are averted by the introduction of drunk driving legislation is slightly optimistic compared to a more recent systematic review (Vecino-Ortiz et al., 2022) of the evidence in LMICs that suggests an estimate of 3.5%.28
For speeding, we think the estimates assumed are likely too high and too persistent, given the evidence. This is less important to the BOTEC, as Hendrie et al. estimate speeding legislation has not contributed much to Bloomberg’s impact (due to a mix of only three policies being changed, and two of these being deemed by the authors to be ineffective).
Chinese national disease surveillance system suggests a generally increasing trend in burden before 2011, followed by a decline
As described above, in 2011, China amended its national road safety laws to punish impaired driving more harshly. The civil penalties for “driving after drinking (0.02 % ≤ BAC < 0.08 %)” were increased, and criminal penalties for “driving after drunkenness (BAC ≥ 0.08 %)” were introduced for the first time.29 According to the analysis done by Hendrie et al., these legal changes saved about 78,000 lives, which is about 33% of the estimated lives saved by all legislative changes in all countries considered in the analysis. Since this estimate is a large fraction of Bloomberg’s total estimated impact, and it relies on assuming that these particular impaired driving laws in China had the effects that impaired driving laws were found to have in international systematic reviews, we wanted to check that actual observed road safety outcomes in China seemed consistent with these laws having a large effect. We investigated various data sources, summarized in the below table. Table 2: Data sources on road safety outcomes in China
| Data source | Description | Shows improvement after 2011 drunk driving law? |
| Global Burden of Disease 2019 (IHME) | Modeled global estimates of road traffic deaths | Yes |
| Global Health Observatory (WHO) | Modeled global estimates of road traffic deaths | Yes |
| China’s Ministry of Transport | National data on road traffic deaths | No |
| China’s National Bureau of Statistics | National data on road traffic crashes | No |
| China’s Ministry of Public Security | National police data on deaths from road traffic accidents attributed to alcohol use, per person and per driver | No |
| China’s national disease surveillance system | Estimates of road traffic deaths per person, based on a representative sample | Yes |
Overall, we judge that the data from the national disease surveillance system is probably the best available source on historical road traffic fatalities in China, due to its large sample size and its efforts to account for the cause of every death in the monitored population, and considering potential issues with both the official records and the global models. According to the surveillance system data, 2011 was the year of peak road traffic mortality per capita, with a generally increasing trend before the year 2011 followed by a 3% decline in road traffic mortality per capita from 2011 to 2012, and another 3% decline from 2012 to 2013.
For further discussion of each data source, see Appendix C.
Vietnam’s Ministry of Health data show sustained reductions in road fatalities after 2007/2008
As described above and in Appendix A, Vietnam has implemented a number of road safety laws since 2000. In Hendrie et al.’s analysis of the Bloomberg portfolio, Bloomberg receives credit for Vietnam’s legislation requiring motorcycle helmets on all roads, enacted in 2007, as well as Vietnam’s legislation increasing the penalties for drunk driving. Hendrie et al. estimate that these two legal changes saved about 81,000 lives (~28,000 attributed to the helmet law and ~53,000 attributed to the drunk driving law), which is about 34% of the estimated lives saved by all legislative changes in all countries considered in the analysis. In this section, we investigate several data sources to assess whether actual observed road safety outcomes in Vietnam seem consistent with these laws having such large effects.
Table 3: Data sources on road safety outcomes in Vietnam.
| Data source | Shows improvement after 2007 helmet law? | Shows improvement after 2011 drunk driving law? |
| Global Burden of Disease 2019 (IHME) | No | Yes (~3% decline in deaths) |
| Global Health Observatory (WHO) | No | No |
| Vietnam’s National Traffic Safety Committee | Yes (~12% decline in deaths) | Yes (~16% decline in deaths) |
| Vietnam’s Ministry of Health | Yes (~19% decline in deaths) | Yes (~3% decline in deaths) |
Overall, we judge that the data from the Ministry of Health is probably the best available source on historical road traffic fatalities in Vietnam, and we think that the reported ~3% decline in deaths after 2011 likely reflects a real improvement. The 19% decline after 2007 may in part indicate a real underlying improvement, but also seems to be, at least in part, an artifact of an unusually high fatality count in 2007, so our best guess of the real improvement after 2007 would be considerably lower than 19%.
For further discussion of each data source, see Appendix D.
Resulting adjustments to estimating lives saved
Together, these elements led us to adjust Hendrie et al.’s estimates of the effectiveness of each of the three laws in China and Vietnam downwards by 40 - 80%. Additionally, our case studies of the changes led us to further reduce the estimated contribution of Bloomberg’s initiatives , previously assumed to be 75% contribution for 10 years of impact. Our approach is to specify a speed up parameter , which attempts to capture both direct speed up (bringing forward the introduction of legislation by putting the issue on the agenda) and indirect speed up (providing technical assistance to design and develop effective laws now that otherwise would not have existed for some length of time). In both China and Vietnam, we think the majority of the impact from advocacy was indirect, such that laws were improved against some counterfactual. We estimate that philanthropic efforts should be credited with the equivalent of 0.4 years of the lives saved by the policy change in China, and the equivalent of 3.8 years in Vietnam.
A comparison of our BOTEC’s approach to estimating lives saved versus previous evaluations can be seen in the table below. The result is that our estimate of lives saved in China and Vietnam is 17% of the previous shallow.
Table 4: Side-by-side comparison of approaches to modeling lives saved
| Model element | Hendrie et al. | OP shallow | RP version |
| Countries included | All Bloomberg countries | China and Vietnam only | China and Vietnam only |
| Baseline fatality data | Linear projections based on data from the WHO and Global Health Data Exchange | Implicitly the same as Hendrie et al. | GBD 201930 |
| Effectiveness assumed | Not known, but we assume the same as Miller et al. (2018) | Implicitly the same as Hendrie et al. | 40% - 80% of what we think Hendrie et al. uses |
| Bloomberg contribution assumed | 100% | 75% | Incorporated into our speed up parameter |
| Time period for impact | From the year the law changes up to 2030 | 10 years only | China: 0.4 years
Vietnam: 3.8 years |
| Resulting estimate of lives saved | 311,758
(159,607 if only Vietnam and China) |
70,414 | 11,958 |
Our estimated ROI of ~1,500x suggests that this topic is worth exploring further
Case selection for our BOTEC was driven by a need to better understand the largest sources of lives saved in Hendrie et al.’s impact evaluation. As a result, we focused on scenarios that are limitedly generalizable: China’s population makes any national legislative change exceptionally impactful, and Vietnam appears to be widely considered as a success story in road safety policy advocacy. As such, if we take our best estimate of philanthropic spending that helped to achieve these policy changes ($5.95 million), we calculate a very high ROI of 6,394x.
However, this does not take into account the reality that advocacy for changes to road safety laws can fail. Open Philanthropy’s initial BOTEC factored this in by using the entire costs of Bloomberg’s work in every country between 2007 - 2020 ($259 million). This is likely to produce an underestimate though, because the approach ignores any lives saved by Bloomberg’s efforts in other countries, and likely overestimates costs since not all Bloomberg’s funding will go towards advocacy.31
Our approach is to use a “risk of failure” parameter, using Charity Entrepreneurship’s finding that in a sample of 84 road safety advocacy campaigns, 52% are unsuccessful. We adjust upwards because we think it’s likely that the underlying sample is biased. Using our risk of failure parameter to adjust our estimate for China and Vietnam, we estimate an ROI of 1,544x, or $65 per DALY averted, which suggests that this topic is worth further consideration by Open Philanthropy and others. Generalizing this result to other scenarios still involves some implicit assumptions, such as similar levels of spending for each campaign, and similar contributions in terms of speed up for those that are successful.
Table 5: Comparison of cost-effectiveness results, for varying methods of estimation
| Cost-effectiveness calculation | OP BOTEC (2022) | RP BOTEC (2023) | Comments |
| Use estimated philanthropic spending in China & Vietnam only ($5.95 million) | - | 6,431x | Selection of successful cases means this is not generalisable |
| Use all Bloomberg spending from 2007 - 2020 ($259 million) | 1,100x | 148x | Does not account for benefits in other countries, or the fact that not all Bloomberg spending is for advocacy. Likely to underestimate. |
| Adjust our result for China and Vietnam using a “risk of failure” parameter (~75%) | - | 1,544x (suggested) | Generalizing implicitly assumes similar levels of spending and speed up in other countries; “risk of failure” parameter is not population weighted |
Note that we are especially uncertain about our “risk of failure” parameter, which currently implies that about one in every four philanthropic attempts to change road safety policy succeeds. If we had more time to refine our estimate, we might more closely investigate the characteristics of Charity Entrepreneurship’s sample, and the extent to which a success in that sample is comparable to the successes in China and Vietnam that we have reviewed in this report.
How change happens
Many countries still lack adequate laws for speeding and drunk driving
The WHO Global Status Report on Road Safety (2018) highlighted that, as of 2017, many countries did not have good legislation in place to manage the risk factors that increase road burden. According to Charity Entrepreneurship (2022), “the presence of these best practice laws is much less common in middle- or low-income countries than in high-income countries: 37% and 13% in middle- and low-income countries, respectively, compared to 50% in high-income countries.”
The figures below show the variation by country, and the live infographic shows more detail on why certain countries are lagging behind best practice.32 Charity Entrepreneurship have also compiled this information in a spreadsheet here.

Figure 5: Infographic map showing which countries have good laws for speeding (green) and which do not (red). From WHO (2018) .

Figure 6: Infographic map showing which countries have good laws for drunk driving (green) and which do not (red). From WHO (2018)
Blair Turner (GRSF) confirmed that this was still the case in 2023, and many countries do not have adequate laws for alcohol and speed. He stated that underinvestment in road safety by governments is often due to a lack of understanding of the problem's magnitude. For instance, Turner suggested that in certain low-income countries, official records only account for 10% of road safety casualties, underrepresenting the actual issue. Some governments mistakenly believe that higher road speeds boost the economy, ignoring the detrimental effects on road safety. Turner also noted that road safety is a complex issue managed by multiple governmental departments or ministries. The infrastructure ministry usually bears the costs of road safety improvements, whereas the health ministry experiences the direct impacts of unsafe roads.
Historically, national legislative changes that address a package of risk factors or individual factors are both common, and there’s no strong evidence of regional spillover effects
Based on the insights shared by our interviewees, it seems that whether laws are passed as packages varies significantly and depends on the context in which they are passed. Xiaojing Wang from Vital Strategies suggested that if a law is very outdated, a whole new comprehensive law could be passed. Otherwise, efforts are often directed towards amending a particular part of the law that focuses on an individual risk factor. For our case studies, we saw that in Vietnam, a comprehensive law was passed initially, and specific parts were amended later. In China, the efforts in our case study have been around drunk driving laws specifically. We have also heard different perspectives from different interviewees.
Atsani Ariobowo from the GRSP pointed out that laws are typically passed as packages at the national level; a case in point was a comprehensive law in India. Ariobowo further mentioned that at state or city levels, laws could be more specific. On the other hand, Kim Lua from the GRSP suggested that laws often consist of a combination of rules, but not large packages – for example, seat belts and child restraints laws. When it comes to enforcement, different ministries or agencies oversee different parts of the law, typically dividing it up into individual rules.33
The experts we interviewed also shared different perspectives on whether legislative change in one country spurs on change in neighboring countries. Atsani Ariobowo indicated that he does not see evidence of policy spillovers across countries, although subnational spillovers are common. In contrast, Kim Lua highlighted that countries do try to learn from each other's initiatives. He cited Vietnam's learning from Singapore and Malaysia as an example. According to him, local NGOs, researchers, and regional networks like ASEAN play significant roles in promoting policy exchanges among countries. AIP Foundation also indicated that there were spillovers, mainly through the efforts of NGOs that work in various countries.
We also briefly considered literature on this question. We weren’t able to find a source that outlines policy over time by country (either globally or in a region, e.g. South East Asia) which would have allowed us to track this chronologically; in the absence of this, we hypothesized that if regional spillovers were occurring, then a snapshot of laws at a given time should show some level of homogeneity within regional blocks.34 Using the WHO interactive map of laws in 2017/18, we did not find strong evidence for spillover effects.35
Overall, our impression is that national legislative changes have limited knock-on effects, and that learning between subnational regions is more probable.
Other non-legislative interventions of interest could include enforcement, advanced vehicle technologies, medians, and integrated public transport
As per the brief, we have spent very limited time looking at this question. Vecino-Ortiz et al. (2018) summarize the effects of various road safety interventions grouped into several categories: enforcement, device effectiveness, community (education), infrastructure, and law and legislation.
The full list of interventions, and the minimum and maximum effects (measured by RR) found in the literature, can be found in Table 1 of the article. The results for interventions in the enforcement and infrastructure categories show effects on mortality, injuries, and crashes that are consistently comparable to or better than interventions in the ‘law and legislation’ category. However, we have not spent any time assessing the underlying papers cited by the review, or looking into the costs associated with each kind of intervention; our prior here would be that building infrastructure is likely to be significantly more expensive than changing legislation.
We also spent about five hours going through the interventions listed in the Guide for Road Safety Interventions by GRSF (part of the World Bank) from 2021. Here is an overview of interventions listed there, with our brief assessment of whether they are promising to look into in more detail. From this exercise, we want to highlight the following interventions which are not focused on legislation, as they may be promising enough to warrant further investigation:
- Advanced vehicle technologies: The evidence in the original report is not so convincing, because it mainly focuses on factors which are only effective in the road conditions typically found in HICs (such as automated lane-keeping). However, we came across another source (Godthelp, 2023), which argues that cheap in-vehicle technologies could be developed to assist drivers in LMICs, without having to update all roads physically to be safer. Some examples mentioned are warning and advice systems for safe speed given road circumstances, and suggesting the safest route. This could be built into cars, or in navigation apps on smartphones. Although the initial investment is still high, it could then be applied in many settings. An intervention could be to fund research directly or advocate research on this.
- Medians: Physical barriers or spaces that separate opposing lanes of traffic reduce head-on collisions and can help pedestrians cross safely. These can be painted or constructed. We think this is an example of relatively cheap infrastructure that could improve road-safety, although they are only relevant for specific road types.
- Integrated public transport and separated bicycle facilities: We want to mention them here because we believe these have large benefits outside of road-safety. By reducing the number of cars in city centers, these interventions could improve air quality and support economic development by reducing commute times.36 When only looking at road safety, we think these interventions are too expensive to be highly cost-effective.
Funding by other organizations
Multilateral development banks spend $0.7 billion - $1 billion per year on road safety, and tend to focus mostly on infrastructure and institutional support
The biggest sources of funding for road safety projects are multilateral development banks (MDBs). For example, over the period 2018 - 2022, seven MDBs committed $3.6 billion toward road safety initiatives, including particularly large projects in Bangladesh, India, and Romania (Holzman, 2023). This constituted close to 9% of all MDB road sector lending during this time (Road Safety Working Group, 2023, p.2). In 2022, the World Bank reported $949 million of investments in road safety projects, which is equivalent to ~17% of the $5.5 billion invested in transport in the same year (GRSF, 2022, p. 4).37
Road safety appears to have been a focus of these organizations for over a decade. In 2009, seven development banks outlined joint initiatives to tackle the growing burden (Inter-American Development Bank, 2009). This was followed in 2014 by the publication of “Road Safety Guidelines… which aim to establish a common approach on road safety, specifically for road and transport projects funded by multilateral development banks” (UN Conference on Trade and Development, 2017, p. 39). In November 2020, ten development banks committed to continued focus on road safety, and the statement indicates that they established a working group with the intention to define deliverables in February 2021 (European Investment Bank, 2020). We were not able to find a write-up of the deliverables.
We spent half a day trying to understand how these funds are spent, and spoke to Blair Turner, a consultant for the World Bank’s Global Road Safety Facility (GRSF).38 It was striking to us that 50% of MDB financing is being directed to South Asia; the remaining funding is divided between Europe and Central Asia (18%), Sub-Saharan Africa (12%), East Asia and the Pacific (11%), Latin America and the Caribbean (6%), and the Middle East and North Africa (3%) (Road Safety Working Group, 2023, p. 7). However, we could not find any breakdown by country.
Our impression is that the vast majority of spending on road safety is part of larger infrastructure projects with which MDBs are involved. In the table below, we attempt to roughly estimate the breakdown of the $3.6 billion committed to road safety in 2018 - 2022.
Table 6: Estimated breakdown of MDB spending by category
| Category
|
Estimated spend (2018 - 2022)39 | % of category | % of total |
| Road safety components of larger infrastructure projects40 | $2.71 billion | - | 75% |
| Infrastructure safety engineering | $1.33 billion | 49% | 37% |
| Road safety management41 | $651 million | 24% | 18% |
| Road user behavior | $352 million | 13% | 10% |
| Vehicle safety | $217 million | 8% | 6% |
| Post crash care | $163 million | 6% | 5% |
| Large standalone road safety projects | $858 million42 | 24% | |
| India | $500 million | 14% | |
| Bangladesh | $358 million | 10% | |
| Global Road Safety Facility | $30.8 million43 | - | 1% |
| Total | $3.6 billion | - |
The breakdown of the first category reflects Blair Turner’s description of road safety spending at the World Bank; he suggested this mostly funds projects to build infrastructure, followed by spending on institutional support (such as technical assistance, capacity building, and risk management) as well as advocacy work and legislation reviews. As examples, he suggested infrastructure projects could include making a footpath to protect pedestrians from motorized vehicles. Technical assistance could involve gathering data and doing risk assessments, and advising how to adapt on an institutional level to deal with risks (e.g., putting in place a good crash data system).
We also spent 30 minutes looking into the ongoing $1 billion road safety project in India, which is being co-financed by the government ($500 million), Asian Development Bank ($250 million) and World Bank ($250 million). According to the World Bank (2022), the program covers seven states for a period of six years. This report also provides a good overview of activities to be financed by the World Bank during this time period, with the relevant overview table copied below as Table 7. Very briefly, the program focuses on assessing and improving road infrastructure ($50 million, 20%), improving vehicle assessments and post-crash care (each $30 million, 12%), and installing autonomous speed enforcement ($20 million, 8%). There is also $40 million (16%) in results-based financing for demonstrated reductions in crash fatalities.44 We did not quickly find a similar breakdown for the other three-quarters of the project.45
Table 7: World Bank disbursement linked indicators (DLIs) and allocation of external resources (in USD millions). From World Bank (2022, p. 10).

Bloomberg is the biggest philanthropic funder, disbursing $40 million per year to ten implementing partners across 15 countries, with a focus on speed
Open Philanthropy’s previous work on road safety highlighted that the largest source of funding for road safety is Bloomberg Philanthropies’ Initiative for Global Road Safety (BIGRS). The current phase has a budget of $240 million between 2020 - 2025, or $40 million per year.46 The program operates in 15 countries, with a focus on 30 cities.47 The major thematic focus of the current phase of BIGRS is speed.48
We were not able to identify how much every consortium partner is receiving, and so we still have a considerable level of uncertainty about the activities that are being funded by Bloomberg’s grantmaking. However, we did a deeper dive on three of the implementing partners that seem to be the most important: Global Road Safety Partnership (GRSP), Vital Strategies, and the Global Road Safety Facility (GRSF) at the World Bank. Our estimate is that these three partners may receive ~50% of the funding (75% confidence interval: 35% - 60% of the funding). The Global Health Advocacy Incubator (GHAI) may also be a significant recipient focused on policy change, but we weren’t able to quickly estimate how much the organization receives.49
In the table below, we include summary details about the three partners we think are likely to be the largest recipients. More detail on these partners, as well as brief descriptions of the other partners, can be found in Appendix E. Our best guess is that Bloomberg’s portfolio focuses more on service delivery (including capacity building), then advocacy, then research. Advocacy (at the national or city level) may amount to roughly 25% of the portfolio (70% confidence interval: 15 - 35%).50
Table 8: Three prominent BIGRS implementing partners
| Implementing partner | Estimated BIGRS funding | Description of activities |
| Global Road Safety Partnership | ~$10m per year51 | Largest and most relevant activity is the “Advocacy and Grants Program,” which directs the majority of its funding to advocacy for national policy.52 Currently has $5 million of active grants. Also conducts leadership training and police capacity building. |
| Vital Strategies | ~$9m per year | Xiaojing Wang describes three teams: 1. Coordination - manages the collaboration agreement on behalf of Bloomberg Philanthropies and the 10 technical partners, enabling technical assistance across different areas of the initiative (namely: enforcement of road safety legislation and strategic communication; infrastructure for safer streets and safer mobility; strengthening surveillance systems for deaths and injury). The team also supports cities in developing multisectorial coordination mechanisms and city-wide road safety strategies, and co-manages with cities a pool of 120 coordinators embedded in cities. 2. Surveillance data system strengthening. 3. Strategic communication, including earned media and mass media for behavior change. |
| Global Road Safety Facility | Unknown, but probably <$5m | Prioritizing spending on safer roads ($2 million in FY22) and safer speeds ($1.5 million in FY22). Focus on speed management (knowledge sharing and research), road infrastructure safety assessments (which are then leveraged to support World Bank-financed projects) and improving data management |
Other organizations also fund road safety initiatives, including the FIA Foundation (~$14m per year) and the UN Road Safety Fund (~$5m per year)
We spent a short amount of time investigating other funders of road safety initiatives, beyond Bloomberg Philanthropies.
We gained the most insight into the United Nations Road Safety Fund (UNRSF), as we spoke to Head of the Fund, Nneka Henry. Their mandate is to channel best practices in road safety, proven to be successful, to LMICs; they do this by providing technical assistance and funding for municipal, national, regional or global projects proposed by countries. The Fund launched their first projects in 2019, and have disbursed $8.66 million to implementing projects so far, with one-third of this being spent to improve the behavior of road users.53 Funding is raised from nations (41%), and corporations and philanthropists (69%) (UNRSF, 2023, p. 14). The single largest donor appears to be the FIA Foundation (see below), which contributed up to $10 million.
Nneka Henry shared that, due to funding constraints, UNRSF is currently only awarding $4 million per year,54 with a cap of $500,000 per project, despite receiving 80 – 100 project proposals valued at over $100 million per year.55 Proposals that are not selected are used to inform the UNRSF Country Captures report, which indicates some key national priorities for road safety (and is discussed more below).
Other philanthropic actors investing in road safety seem to be:
- The FIA Foundation: This organization spent roughly $14 million on grantmaking in each of 2021 and 2022.56 Based on their 2022 report, they work across a range of behavioral risk factors (including helmet safety and speed management), and fund road safety assessments and small infrastructure projects. Some relevant grantees include the UN Road Safety Fund (UNRSF), other UN programs such as UNICEF and UNEP, the AIP Foundation, and AMEND.org.
- Fondation Botnar: This organization also funds implementation through the GRSP, awarding grants through the Botnar Child Road Safety Challenge (BCRSC). This program focuses on medium-sized cities, and made its first allocations in August 2018. By 2021, GRSP reported total spending of $17 million, or approximately $6 million per year (GRSP, 2022, p. 13). Atsani Ariobowo (GRSP) manages the BCRSC and shared that there is more focus on implementation than advocacy, but some policies that have been demonstrated to be effective at the municipal level have been taken up nationally, e.g., safe school zones in Vietnam.
- AIP Foundation:
The AIP Foundation works on education, legislative advocacy, and access
to safe equipment. They appear to focus on all five risk factors to varying
extents in different countries. Their operating budget for 2022 was $2.7 million
(of which $1.8 million was spent on programs); 60% of their funding comes from
foundations and nonprofits, with another 30% from corporate sources (AIPF, 2022, p. 26). AIP Foundation shared
with us that their major funders currently include the FIA Foundation, Bloomberg
Philanthropies (via the GRSP), and more recently, Fondation Botnar. They are
also supported by other sources for specific projects, e.g. Johnson & Johnson
and the Prudence Foundation.57
There may be opportunities for advocacy for speeding laws in Pakistan and Thailand, as well as advocacy for enforcement in Nigeria and Indonesia
We took several steps to turn our understanding of the road safety funding landscape into an assessment of where there might be gaps for grantmakers to consider. These steps included:
- Capturing a sample of ongoing projects (including but not limited to advocacy) by country in a spreadsheet, with information about funding and focus where available.
- Creating a backwards BOTEC for speed and drunk driving legislation that outputs the required speed up (in years), based on our assumptions about how impactful such laws can be, and inputs for ROI and grant size.
- Checking whether laws in place are already sufficient, according to the WHO Global Status Report on Road Safety (2018).
- Reading through the UNRSF’s Country Captures report to understand whether speed or drunk driving legislation has already been indicated as a national priority.
- Incorporating expert views on the policy landscape, where stated.
The countries that Bloomberg works in generally make sense as high-burden,58 tractable countries. We don’t think there are any striking misallocations, though there do appear to be some gaps.
Table 9 below provides an overview of our thinking on the 25 countries with the largest DALY burden according to GBD 2019.59 Although it’s likely that our sample of ongoing projects is incomplete, it does suggest that efforts are concentrated in Bloomberg-funded countries; in many countries, UNRSF is the only partner with ongoing involvement, and their projects are limited in size due to funding constraints.
We focused on drunk driving and speeding laws specifically, following our initial assessment of the risk factors. In high burden countries, our backwards BOTEC suggests a $1 million grant would generally need to speed up legislation by an average of 0.8 years (range: 0.1 - 1.7) for drunk driving, and 0.3 years (range: 0.1 - 0.6) for speeding, though we have significant uncertainty about our estimates for speeding legislation.60 Based on our conversation with AIPF, we think a $1 million grant would fund 2-3 years of advocacy.
Our current thinking is that the top candidates for advocacy for policy change are:
- Pakistan: The maximum urban speed limit is 90km/h (UNRSF, 2022, p. 51), versus best practice of 50 km/h or lower. Though there has been significant investment in other South Asian countries, Pakistan seems to be neglected by comparison. Our backwards BOTEC suggests the required speed up is 0.2 years, though as mentioned we are uncertain about this estimate.
- Thailand: The urban speed limit is 80km/h (UNRSF, 2022, p. 66), versus best practice of 50 km/h or lower, and the UNRSF country captures report (2022) suggests the government is open to addressing speed management, including via legislation (pp. 66 - 67). Our backwards BOTEC suggests the required speed up is 0.3 years, though, as mentioned, we are uncertain about this estimate. It’s worth noting that Bloomberg worked here from 2015 - 2020, but is not working in Thailand in the current phase.61
We have not investigated the tractability of advocacy in these two countries. However, concerns about tractability (specifically, US sanctions) cause us to only tentatively suggest Iran, where there may be an opportunity for impactful technical assistance as the UNRSF Country Captures report (2022) highlights national willingness to revise national protocols for speed limit setting (p. 49).
In addition, there also seem to be gaps in Indonesia and Nigeria, with limited philanthropic work on road safety despite the large burden. What we’ve read suggests that this is due to lack of enforcement rather than weak laws, which could lend itself to advocacy for greater investment in enforcement of existing laws. It’s not immediately clear how our existing BOTEC would be applied to this kind of advocacy, but corruption (particularly in the police) would be an important factor to consider when assessing the tractability of such grantmaking.
Table 9: Ongoing investment in countries with the largest DALY burdens due to road injuries
| Ongoing involvement | Law sufficient?62 | ||||||||||||
| Country | GRSP | Botnar | IACP | VS | GRSF | GHAI | UNRSF | AIPF | FIA | Alcohol | Speed | Comments | Advocate? |
| India | Y | Y | Y | Y | Y | Y | Y | Y | N | N | Well-funded, MDBs also contributing heavily; UNRSF targeting | No | |
| China | Y | Y | Y | Y | Y | Y | Y | Experts suggest national change difficult; Bloomberg covered | No | ||||
| Brazil | Y | Y | Y | Y | Y | Y | Y | N | Bloomberg covered | No | |||
| Indonesia | Y | Y | N | Y | UNRSF: highlights limited enforcement | Yes - enforcement | |||||||
| Democratic Republic of Congo | Y | N | N | Unclear there is state capacity (for enforcement) | No | ||||||||
| Pakistan | Y | N | N | UNRSF: speed law particularly bad | Yes - laws | ||||||||
| Egypt | Y | N | N | Possible concerns about how easy to work with local civil society | Probably no | ||||||||
| Nigeria | Y | Y | Y | Possible concerns about security; hard to partner at city level; UNRSF: gap is enforcement | Yes - enforcement | ||||||||
| Vietnam | Y | Y | Y | Y | Y | Y | Y | N | N | AIPF working on comprehensive legislation; well-funded | No | ||
| Mexico | Y | Y | Y | Y | Y | Y | Y | ? | ? | Recent legislative success; Bloomberg covered | No | ||
| Iran | Y | N | N | UNRSF: revision of national speed protocols | Yes - laws | ||||||||
| Saudi Arabia | N | N | Unassessed | ||||||||||
| Thailand | Y | Y | Y | N | UNRSF: poor speed law; gov’t interest in “interventions” | Yes - laws | |||||||
| South Africa | Y | Y | N | N | Maybe yes | ||||||||
| Bangladesh | Y | Y | Y | Y | Y | N | N | Large MDB financed road safety project | No | ||||
| Yemen | ? | ? | Likely intractable | No | |||||||||
| Philippines | Y | Y | Y | Y | N | Y | Unclear whether this is a BIGRS country (sources conflicted) | Maybe yes | |||||
| Algeria | ? | ? | Unassessed | ||||||||||
| Angola | N | N | Unassessed | ||||||||||
| Ethiopia | Y | Y | Y | N | N | VS working on comprehensive national plan; Bloomberg covered | Probably no | ||||||
| Ukraine | Y | Y | Y | Y | Y | N | Likely intractable | No | |||||
| Afghanistan | Y | N | N | Likely intractable | Probably no | ||||||||
| Morocco | Y | Y | N | UNRSF: gap in enforcement | Probably no | ||||||||
| Colombia | Y | Y | Y | Y | Y | Y | Y | Y | N | Bloomberg covered; UNRSF highlights lack of post-crash care | No | ||
| Turkey | N | Y | UNRSF country capture: 30km/h zones a national need | Maybe yes | |||||||||
What we would do with more time
- Better understand what has previously been funded by the World Bank, e.g. by reading World Bank (2014).
- Investigate the idea of a “Global Road Safety Incentive Fund,” which is mentioned in MDB Working Group on Sustainable Transport (2019): “Mobilizing more and new resources for road safety: A proposal for MDB Global Road Safety Incentive Fund has been developed and was discussed with donors but with limited success. Challenges remain in taking the issue of resource mobilization further” (p. 9).
- Better understand whether projects funded by other MDBs have a similar
breakdown as those funded by the World Bank.
- One way to do this would be to look at a list of historical projects. A helpful source for projects between 2016 - 2018 is MDB Working Group on Sustainable Transport (2019), p. 11 onwards.
- Read Haghani et al. (2022) on gaps in road safety research in the context of LMICs.
- Read Chen et al. (2023) on the empirical relationship between road safety targets and achievements.
- Look at the methodology behind the prediction of autonomous vehicle trends that we found by Litman (2023) to form an opinion on its robustness.
- Investigate options to improve road safety in LMICs, e.g. by reading this ERSO (2018) report on advanced driver assistance systems, or talking to Hans Godthelp, the author of the paper “Towards a safe system in low- and middle-income countries: vehicles that guide drivers on self-explaining roads” (2023).
- Talk to someone in the central team at the Global Health Advocacy Incubator (GHAI).
- Read more about the potential impact of vehicle standards, and try to project their impact. Sources could include this 2016 estimate for Latin America, Lloyd et al. (2016), and this UN cost-benefit analysis of the implementation of their vehicle regulations.
Contributions and acknowledgments
Aisling Leow, Erin Braid, and Carmen van Schoubroeck were the main authors of this report. Erin Braid edited the client-facing version of the report to transform it into a public-facing report. Melanie Basnak reviewed and supervised this report. Thanks to Adam Papineau for copyediting, to Rachel Norman for assistance with publishing the report online, and to James Hu for formatting and graphing assistance. Further thanks to Nneka Henry, Blair Turner, Atsani Ariobowo, Kim Lua, Lulu Xue, Xiaojing Wang, Jimmy Tang, and Phong Le for taking the time to speak with us.
If you are interested in Rethink Priorities' work, please consider subscribing to our newsletter. You can explore our completed public work here.
Appendices
Appendix A: The history of Road Safety Regulations in Vietnam
The government in Vietnam has been actively working on road safety. Below, we describe the history of road safety regulations, based on the Road Safety Performance Review of Vietnam by the United Nations (2018). It is not so easy to pinpoint the exact dates when laws came into effect, since sometimes a resolution that precedes implementing part of law is passed before the law itself. Also, this information is spread throughout the report and is not always self-consistent. This is probably in part because changing a law has several stages. Table A1 below shows a detailed description of the history of the helmet wearing legislation, which illustrates this point. For example, the ‘2008 helmet law’ came into effect in 2009, but there was a resolution by which wearing helmets was already compulsory in 2007.
Vietnam has a National Traffic Safety Committee (NTSC) which was established in 1997. It is an inter-ministerial body that is responsible for coordinating activities related to traffic safety across various ministries and sectors. The NTSC's main tasks include advising the Prime Minister on strategies, policies, and laws related to traffic safety, coordinating traffic safety activities, and monitoring and evaluating the implementation of traffic safety measures. (p.10)
The first Road Traffic Law in Vietnam was adopted in 2001, building upon a 1995 decree. It was a response from the government to a sharp increase in road casualties.63 However, “[d]ue to the poor preparation of these documents, the regulations only required motorbike and motorcycle drivers to wear helmets on non-urban roads, so this policy was largely unsuccessful” (p.28).
In 2008, the Road Traffic Law was amended,64 and the new version came into effect in 2009. However, AIPF (Goldman, 2018, p.37) reports that the law was brought forward by several months and passed in December 2007. We think it might be the case that the official law came into effect in 2009, but in practice it was already effective through a resolution. The 2008 law emphasized traffic safety, implementing stricter measures than the 2001 version. It incorporated regulations successful in developed countries, including guidelines on helmet use, alcohol testing, mobile phone use while driving, and seat belt usage (adapted from p.7). This was followed by “one of the greatest falls in the number of fatalities related to traffic accidents ever recorded” (p.20).65
In 2011, the Vietnamese Government enacted Resolution 88/NQ-CP to strengthen centralized measures for ensuring traffic safety, which included severe penalties for drunk driving (p. 21).
GRSP (2015) mentions a legislative change in 2013, which is not mentioned in the Road Safety Performance Review: “[I]n 2013, Vietnam penalties were established for motorcyclists wearing helmets that failed to meet safety standards.”
In 2014, Vietnam officially joined the 1968 Convention on Road Traffic and the 1968 Convention on Road Signs and Signals, marking its commitment to international road safety standards. “However, many regulations under these and other international conventions related to road safety have been partially implemented by Viet Nam since 2005” (p.8).
In 2016, legislation was updated again, including revised fines for drunk driving and more stringent speed regulations (p.29, p.71). Also in that year, a law was passed to regulate safety standards for motorcycle helmets (p.28).
Table A1 : The history of helmet wearing legislation in Vietnam. From Passmore et al. (, 2010, p.2).

Appendix B: Review of Hendrie et al. (2021)
Hendrie et al. (2021) is a Bloomberg-commissioned impact evaluation of Bloomberg-funded road safety initiatives implemented between 2007 and 2018. We briefly reviewed the methodology to understand how they estimated the number of lives saved by these initiatives.
The authors describe computing population attributable fractions (PAFs) for each of the five behavioral risk factors listed above, based on the prevalence of each risk factor and the relative risk (RR) associated with each risk factor. The prevalence estimates are site-specific, based on “observational data at each intervention site [...] collected by the John Hopkins International Injury Research Unit.” The RR estimates are taken from the general literature. For example, RRs for drunk driving at various blood alcohol levels were taken from Blomberg et al. (2005), a case-control study carried out in the United States. As noted above, the paper does not include the calculated PAFs, though we have contacted the authors to ask for more information.
However, these PAFs are only used to estimate the lives saved due to social marketing campaigns, police enforcement, and related road safety activities (which together account for about 13% of the total estimated lives saved); they are not used to estimate the lives saved due to legislative changes, which account for about 75% of the total estimated lives saved. Describing how they estimate lives saved due to legislative changes, Hendrie et al. state that they calculated “lives lost without the intervention times the percentage reduction in deaths attributable to the intervention,” with the percentage reduction coming from Miller et al. (2018), an earlier Bloomberg evaluation.
The effectiveness estimates in Miller et al. (2018) have two components: the expected percentage reduction of legislation (informed by academic literature), and an indicator for the level of enforcement (informed by polling local Bloomberg staff). These are combined in a “multi-step modeling process” to produce estimates for each legislative change within the article’s scope. In some cases, they determine that a policy change is ineffective.
For lives saved due to legislation for drunk driving, which constitutes the largest proportion of the impact in Hendrie et al. (2021), the average percentage effectiveness in reducing fatalities is 4.5% per law (with estimates for specific laws in specific countries ranging from 4% - 15%). In some countries, multiple laws are passed: in Vietnam, for example, three changes to drunk driving legislation are estimated to cause a 13% reduction in fatalities. The underlying literature for the estimate is a systematic review of 33 interventions in the United States, which found that a 4% - 8% reduction was typical (with an upper bound of 17%).66 For each policy change in the Bloomberg portfolio, Miller et al. describe which of the 33 interventions in the systematic review they consider to be most similar, what the percentage effectiveness is, and whether or not they believe this should be downrated due to weaker enforcement. They do not appear to make any adjustments for differences between the US and LMIC contexts.
For comparison, we looked at a more recent global systematic review, Vecino-Ortiz et al. (2022). The authors identify four studies that estimate the country-wide impact of drunk driving legislation in LMICs, and extract 10 point estimates of the percentage change in mortality (see Vecino-Ortiz et al., 2022, Appendix 3). These estimates range from 0% to 31% reduction, with an average of 13% reduction. However, based on the overall methodology of the systematic review, it seems that these estimates are probably intended to describe the percentage change in mortality from crashes due to alcohol specifically. If about 27% of road traffic deaths are attributable to alcohol (rough estimate from WHO (2023)), then these estimates would imply that drunk driving legislation would reduce road traffic deaths by about 3.5% (0% - 8.4%), suggesting that the 4.5% average used by Hendrie et al. is reasonable, though on the optimistic side.
Hendrie et al. (2021) attributes only a small proportion of lives saved to policy change to prevent speeding, because only three such laws were passed (in Brazil, Kenya, and Russia), and two of these were considered by the authors to be ineffective.67 The estimate of effectiveness in Miller et al. (2018) is based on one meta-analysis and one study in Botswana that suggest initial reductions of 10 - 20% with decreasing impact over time; the former suggests reduction to zero within a few months, while the latter suggests this happens over two years.68 On the basis of this, the authors estimate that the initial impact of legislation passed in Kenya is 12% (due to lower enforcement levels), dropping to 8% in year two, and 2% thereafter. Our initial thought is that this seems like a generous interpretation of the evidence. Unfortunately, the global systematic review, Vecino-Ortiz et al. (2022), does not identify any country-wide estimates of the impact of speed legislation in LMICs.
Overall, the estimates used by Hendrie et al. seem to be reasonable based on the available evidence, but as mentioned above, we do query whether they correctly attribute the impact to Bloomberg.
Appendix C: Historical data for China
Modeled estimates
The IHME’s GBD study and WHO’s Global Health Observatory both provide internationally comparable estimates of road traffic deaths, broken down by country and by year. These estimates incorporate observational data where it is available (e.g., the GBD’s data sources for road injuries included “vital registration, verbal autopsy studies, mortality surveillance, censuses, surveys, hospital records and mortuary data”), but also incorporate indicators such as GDP per capita, alcohol consumption per capita, population density, a Healthcare Access and Quality Index, etc.69
The GBD estimates are, at a glance, consistent with a significant trajectory change around 2011.
Figure C1 : Deaths due to road injuries in China From GBD 2019.

Similarly, the Global Health Observatory estimates show a decline in road traffic deaths starting around 2011, though a less dramatic one than in the GBD data – in the GBD data, fatalities declined from about 325,000 in 2010 to about 250,000 in 2019; in the Global Health Observatory data for the same years, fatalities declined from about 280,000 to about 250,000:
Figure C2 : Road traffic deaths in China. Data From Global Health Observatory data repository.

National statistics
By contrast, China’s official statistics do not show this pattern of a decline in road traffic deaths starting around 2011. Data from China’s Ministry of Transport shows a slowing decline in road traffic accident deaths from 2007 through 2015 (focus on the blue line in the figure below; the orange line represents 20x fewer deaths):
Figure C3 : Road traffic accident death toll in China. From Wang et al. (2019).

Similarly, data from China’s National Bureau of Statistics shows the number of road traffic crashes in a slowing decline from about 2002 to 2015. Note that this is the number of crashes, not deaths; we have not found collated fatality data from this source. The number of crashes each year is indicated by the squares in the following figure:
Figure C4 : Road traffic crashes in China. From Wang et al. (2018).

The official statistics also include data on alcohol-related road traffic accidents specifically. This data shows that, on a per-person basis, deaths from “road traffic accidents attributed to alcohol use” declined steadily until about 2010 and have stayed approximately constant since. We found two papers that attempt to directly assess the national effect of China’s 2011 impaired driving laws; both use these official rates of road traffic accidents attributed to alcohol, and so in both analyses, the laws look remarkably bad! Note that the following figures display mortality rates per 100,000 people and per 10,000 drivers, respectively:
Figure C5 : “Crude mortality [...] per 100,000 persons from road traffic crashes attributed to alcohol use in China based on police data, 2006–2015.” From Xiao et al. (2017).

Figure C6 : “Change of annual traffic mortality rates attributed to alcohol use in China based on police data from 2004 to 2017 (a): The level change model (b): The level and slope change model.” Source: Fei et al. (2020).

Most of these official statistics are based on police data, which is generally thought to undercount road traffic mortality, and to not necessarily track genuine trends in road safety. Hu et al. (2011) compare road traffic mortality rates based on police data for the years 2002-2007 to death registration data for the same years, and find that the rate of death due to road traffic based on death registration data was about twice as high as the rate reported by the police. Furthermore, while the police-reported data showed a 27% decrease in road traffic mortality over that time period, the death registration data showed a slight increase overall:
Figure C7 : Road-traffic death rates based on police reports and on death registration data. From Hu et al. (2011).

There may be various reasons that the police data undercounts road traffic mortality, such as differing definitions,70 or institutional incentives to report good outcomes. Furthermore, on the specific topic of crashes due to alcohol, Ma et al. (2012) note that “A concern regarding using the police data comes from the fact that the police report cards list more than 20 causes of crashes, including speeding, drink/drunk driving, taking wrong turns, and driving in the wrong direction. Police officers are expected to check the most ‘direct’ cause of the crash from the list, so a driver under the influence of alcohol who took a wrong turn would be listed as ‘wrong direction’ rather than ‘drink/drunk driving,’ even though the influence of alcohol is the fundamental reason” (p. 61). However, beyond a general tendency to underreport, it is unclear what factors might contribute to the specific trends we see in the police data, and specifically in the police data about deaths attributed to alcohol use. One possibility is that police officers became more inclined to select alcohol as the cause of a crash after the increased government and public attention to the issue in 2011.
Disease surveillance system data
Wang et al. (2019) analyze road traffic mortality in China from 2006 to 2016 using data from “the national disease surveillance points system, a sample-based system that gathers nationally representative data in China for births, cause of death, and incidence of infectious diseases.” Between 2006 and 2016, the system monitored about 73 million people, and registered 115,255 road traffic deaths. This data shows a decline in per-capita road traffic deaths after 2011, the year of peak road traffic mortality:
Figure C8 : Road traffic mortality rate in China, 2006-2016. Source: Wang et al. (2019).

The disease surveillance system seems to be thorough, with efforts made to account for all deaths in the monitored population, and Wang et al.’s analysis seems to be well-conducted. Considering this, and the potential issues with both the official records and the global models, I (Erin) think this study is probably the best single source for understanding the trends in China’s road traffic mortality. However, I don’t have a good understanding of why the official estimates, and especially the official estimates of deaths due to alcohol use, show different trends, and I do find that concerning.
Furthermore, of course, even if we conclude that improvements in road traffic mortality trends coincided with the 2011 impaired driving laws, other factors very likely contributed to those improvements. Wang et al. cite a number of potentially significant changes over the relevant time period: “The mortality decrease probably reflects substantial improvements in transportation infrastructure investment, transition of transport mode, and progress in the health-care system. Between 2011 and 2015, ¥12.5 trillion (Chinese Yuan)71 were invested to improve transportation infrastructure across the country. The number of passengers using trains rose from 5.3% in 2011 to 14.8% in 2016, corresponding to a decrease in the number of passengers using buses (from 93.2% to 81.2% over the same period). The Chinese Government has also been active in policy and public education programmes to improve road traffic safety. A national motorcycle helmet law was passed in 2004 to require both drivers and passengers to wear helmets, and national road traffic safety laws were revised in 2011 to increase safety in several domains, including increased penalties for drunk driving. Continued education efforts have been made by the Chinese Government to raise road safety awareness among the public (eg, the Civilization Traffic Action Plan from 2010). Moreover, a standardized trauma rescue and treatment network has substantially reduced emergency response times, prehospital transport times, emergency rescue times, and consultation call times resulting in lower patient mortality rates.”
Appendix D: Historical data for Vietnam
Modeled estimates
GBD estimates of road traffic fatalities in Vietnam do not show any improvements around 2007. From ~2000 until ~2010 fatalities consistently rose, and in particular, from 2007 to 2008 fatalities rose by about 11%. However, it’s possible that delayed effects of legislation in 2007 could have contributed to the leveling off of fatality numbers around 2009-2012, especially given that there was some iteration in the law after its initial enactment in December 2007.72
The estimates show a somewhat more compelling improvement around 2011, with fatalities falling by about 3% from 2012 to 2013, after rising every year since 2000. Since 2013, fatalities have continued to fall, but at a slower pace.
Figure D1 : Deaths due to road injuries in Vietnam. From GBD 2019 results.

The WHO’s Global Health Observatory estimates show a very different trend from the GBD estimates. According to the WHO estimates, road traffic fatalities in Vietnam generally rose between 2000 and 2014, at an average of about 1% per year; then from 2014 through 2019, fatalities quite consistently rose about 5% per year.
Figure D2 : Road traffic deaths in Vietnam. From Global Health Observatory data repository.
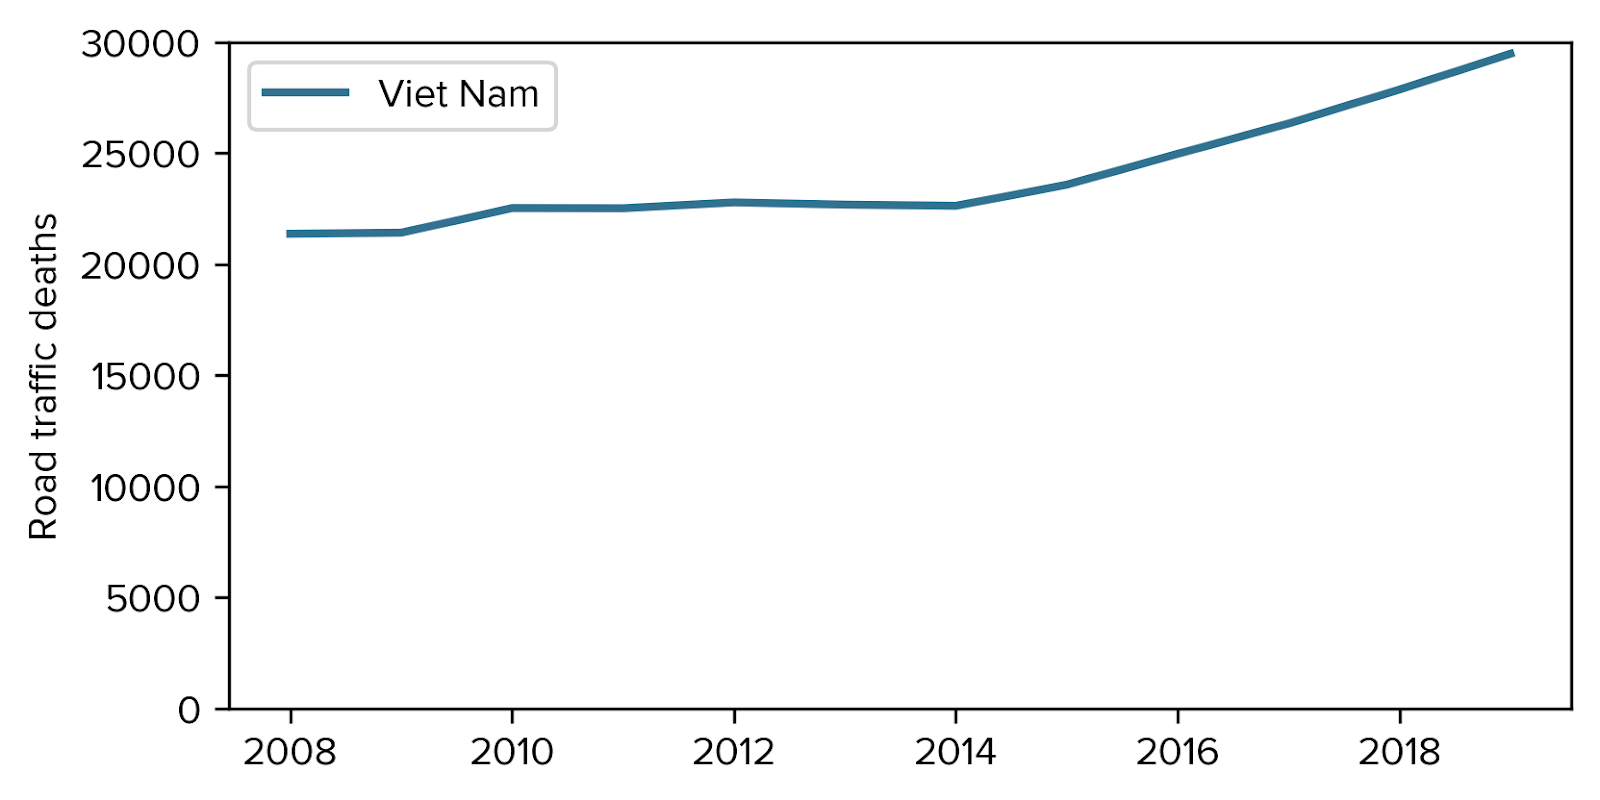
Unfortunately, both the GBD and the WHO estimates are pretty opaque, and we do not have much insight into what assumptions are driving these trends, or where the two methods differ.
National statistics
Vietnam’s official road safety statistics are reported by the National Traffic Safety Committee, and are ultimately based on police reports. The NTSC data shows clear declines in fatalities from 2007 to 2008 (decline of about 12%) and from 2011 to 2012 (decline of about 16%). These declines seem to be departures from trend, and have been attributed to the 2007 motorcycle helmet law and the 2011 drunk driving law, respectively (e.g. UN, 2018).
Figure D3 : Road crash fatalities in Vietnam. From AIP and FIA (2017 , p.48).

Note that NTSC data on the number of road traffic crashes around 2007 shows a pattern similar to the number of fatalities: a decline of about 13% from 2007 to 2008, with much smaller declines in previous and subsequent years. This doesn’t straightforwardly fit with the motorcycle helmet law being the cause of the decline in fatalities, since we would expect helmets to save lives by making crashes less likely to be fatal, not by preventing crashes. However, the data on crashes closely matches the fatality data in absolute numbers, not just in trends: for example, in 2007, when 12,800 fatalities were reported, only 13,985 crashes were reported (UN, 2018, Table 3.4.1-1). This suggests that crashes may often only be reported if they resulted in a death, in which case the data on crashes would naturally follow the trend in fatalities.
NTSC data is thought to systematically undercount fatalities, as well as crashes and injuries (see e.g. World Bank, 2021, p.37). This undercounting can be seen by comparing NTSC data to data from the Ministry of Health, which does not officially publish road safety statistics, but does release some data from its mortality reporting system. Using this data for the years 2005-2013, Pham et al. (2018) report the number of deaths due to injury and the proportion of deaths due to injury that are due to road traffic, from which we have computed the trend in road traffic fatalities. This data shows a dramatic decline in fatalities after 2007: approximately a 19% decrease from 2007 to 2008, though the graph also shows that this could be considered a return to trend after an unusually high fatality count in 2007. This data also shows an improvement after 2011, with a ~3% decrease in fatalities from 2011 to 2012 after several years of increasing fatality counts.
Figure D4 : Deaths due to road traffic injury in Vietnam. Data from Pham et al. (2018).

This Ministry of Health data likely still represents an undercount of fatalities. A more intensive national sample mortality surveillance study, carried out in 2008 and 2009 and covering about 3% of the population of Vietnam, found that the rate of road traffic fatality was 21 per 100,000 population (Ngo et al., 2012), while the Ministry of Health data shows rates of 16.90 and 17.94 per 100,000 for the years 2008 and 2009 (Pham et al., 2018, Table 4).
We tentatively suggest that the Ministry of Health data, adjusted upwards by about 20% based on the findings of Ngo et al. (2012), is the best available source on historical road traffic fatalities in Vietnam. However, considering the conflicting estimates and the sizable undercounting, we are not very confident in its accuracy, especially regarding the dramatic rise and fall in fatalities in 2007-2008. One option for further assessing the reliability of this source is to look into an evaluation of the Ministry of Health’s mortality reporting system (Stevenson et al., 2012; Stevenson et al., 2015), which apparently shows that it is “the most reliable source of mortality data in Vietnam, particularly for injury-related mortality” (Pham et al., 2018), but we have not currently prioritized this.
Appendix E: BIGRS
Geographic scope of BIGRS over time
Table E1: Geographic scope of BIGRS over time

Brief description of ten consortium partners
See below for short descriptions of each of the ten BIGRS consortium partners. They are very loosely arranged with our belief that the first four probably receive the most funding.
Note that these partners also receive funding from other sources. For example, the FIA Foundation also funds projects through the Global New Car Assessment Programme (NCAP) and Global Designing Cities Initiative.
Table E2: Bloomberg consortium partners
| Partner | Description of work |
| Global Road Safety Partnership | Regranting to implementers in BIGRS countries; policing capacity building; leadership training |
| Vital Strategies | Addressing key risk factors, with an emphasis on speed management; supporting infrastructure improvements; improving regulatory frameworks; mass media; improving data collection & monitoring |
| World Bank’s Global Road Safety Facility | Promoting speed management by providing technical expertise, publishing global guidelines (co-funded), and research; funding Road Infrastructure Safety Assessments; piloting new data management systems |
| Global Health Advocacy Incubator | Strategic and technical support for advocacy and media campaigns; legal analysis and support drafting new regulations |
| International Association of Chiefs of Police | Work with in-country law enforcement on implementation |
| World Health Organization | Providing technical support to review and change legislation; advocacy capacity building with lawyers; journalist engagement; creating normative guidance documents |
| World Resources Institute | Policy development, including around speed management; road safety analysis; capacity building; public engagement |
| Global New Car Assessment Programme (NCAP) | Offer technical support and quality assurance guidance for programs in LMICs; promote proven vehicle safety technologies |
| Global Designing Cities Initiative | Knowledge sharing and capacity building to improve urban design |
| Johns Hopkins International Injury Research Unit | Not immediately clear - deprioritized |
Detailed write up of three consortium partners
Global Road Safety Partnership (~$10m per year; low confidence)
Our working estimate is that the Global Road Safety Partnership (GRSP) receives between 15 million per year. We came to this conclusion by back-calculating from their annual reports for 2020 and 2021, see here. We are uncertain about this figure, and believe that if we are wrong, the true amount is likely to be lower rather than higher. As a result, in the body of the report we suggest the funding may be $10 million per year.
Based on GRSP’s annual reports, there are three programs supported by BIGRS. Based on information about spending in one of the programs, it seems like annual expenditure for these three BIGRS-programs is significantly lower than our estimate of what GRSP receives from Bloomberg. This suggests that we may be overestimating, that a proportion of BIGRS funding also supports overhead costs, and/or that GRSP have been unable to find opportunities to spend the whole amount they receive.
To briefly describe each of the programs:
- The Advocacy and Grants Program awards grants to implementers in BIGRS countries. We estimate that they currently award roughly $2.4 million per year, which is an increase versus historic annual grantmaking.1 The infographic below describes the breakdown of this spending. By expenditure, it seems like this program is ~4x bigger than the others.

Figure E1: breakdown of grants in the Global Advocacy and Grants Program, as of April 2023. The overall grants total is $17.4 million. From GRSP (2023).
- The Road Policing Capacity Building program conducts assessments in BIGRS cities, and conducts training workshops. In 2021 they trained 1,300 people in 49 workshops.
- The Global Road Safety Leadership Course conducts training in conjunction with Johns Hopkins University. In 2021 they trained 120 people.
We note that our estimated expenditure across the three programs does not come close to $10 million. It’s possible that Bloomberg supports other elements that we’re not counting here (e.g. salaries), but it’s also possible that our estimate of $10 million is too high.
Vital Strategies (~$9m per year; high confidence)
Based on Vital Strategies (2020) (p. 12), the organization received a $18.5 million grant in 2020 to fund two years of work on road safety.2
The organization describes their work as: addressing key risk factors, with an emphasis on speed management; supporting infrastructure improvements; improving regulatory frameworks; mass media; and improving data collection & monitoring.
We did not find a breakdown of how they distribute funding between these activities.
World Bank’s Global Road Safety Facility (unknown, but probably less than $5m)
Blair Turner indicated that Bloomberg Philanthropies and UKAID are the main funders of the World Bank’s Global Road Safety Facility (GRSF), but could not share how much money they receive from the former. A few factors make us think it’s probably less than $5m per year:
- For the last three years, total spending has been about $6 million per year, according to GRSF (2022) (p. 32).
- BIGRS is not the only funder; the 2022 annual report features the logos of others such as UKAID. Also, the newly approved grants in FY22 include countries that are not in the BIGRS scope; see GRSF (2022) (p. 5).
According to a 2020 GSRF blog post (Raffo et al., 2020), there are three components:
- Speed management: This centers around the “Speed management Hub,” and involves providing technical expertise, publishing global guidelines (co-funded), and research.
- Road Infrastructure Safety Assessments: national-level assessments, which are then leveraged to support World Bank-financed projects
- Data management: piloting a new Data for Road Incident Visualization, Evaluation and Reporting (DRIVER) open-source system to improve data collection, management, and analysis.
Breakdowns of total disbursements in 2021 and 2022 (i.e., not only BIGRS funds) shows that the first two components dominated 2022 spending, with increasing focus on safer speeds.

Figure E2 : GSRF disbursements by theme in FY2021 and FY2022. From GRSF (2021, p. 27), and GRSF (2022, p. 32).
Notes
-
We asked Kim Lua (Global Road Safety Partnership) how “best practice” laws are defined. He described a process by which academics, NGOs, and/or the UN review laws in developed countries that have been proven to be effective, and adapt these for an LMIC context. ↩
-
We have built adjustments into our BOTEC to reflect this uncertainty. ↩
-
As context, this project faced hurdles in securing interviews with local informants from our case study countries, China and Vietnam. We contacted 20 experts, including recommendations from initial interviewees, and posted on two paid interview platforms (Inex One and GLG). Despite this, we only secured interviews with people in China and Vietnam at the very end of the project, and our interviewees were not directly involved in the changes in 2008 - 2014. The difficulties might have been due to a lack of our own network in the area, sensitivity to public discussion about China, possibly language barriers (although we did offer to take interviews in Mandarin Chinese), and the fact that we were asking about events that occurred 10 - 15 years ago. ↩
-
These five factors are widely identified in the literature, e.g., Global Health Advocacy Incubator (2023). In our research, we also came across concerns about driver distraction; see European Commission (2022) for a summary. We have not looked into this as an additional factor. ↩
-
The paper converts from risk attributable fractions to percentage of accidents per risk factor by using age-specific adjustments to account for the simultaneous presence of multiple risk factors in one accident. We also wrote to multiple authors of two papers (Hendrie et al., 2021 and Ralaidovy et al., 2018) that calculate but do not publish risk attributable fractions as interim steps in their analysis, to see if they could share these, but did not hear back. ↩
-
The estimated contribution of drunk driving is similar to GBD 2019, which attributes roughly 6% of DALYs lost due to road accidents to alcohol (GBD, 2020, Figure 2). The study does not include any of the other four factors of interest. ↩
-
We spent 30 minutes looking for any work that tries to explain the drivers of change globally but did not find anything. ↩
-
51% calculated by RP as lives saved by legislative changes in Vietnam (80,638) and China (78, 968) divided by total lives saved estimated by the paper (311, 758). ↩
-
Technically, the new law defines both drink driving (driving after drinking) and drunk driving (driving while intoxicated) based on blood alcohol concentration limits. For simplicity, we refer to both together as drunk driving. ↩
-
Prior to this, the penalty would have been administrative detention, which is shorter and does not go on a criminal record (Xiong et al., 2019). ↩
-
The increase of 40% is calculated by comparing 650,000 prosecutions in 2006 to 304,000 prosecutions in four months in 2009 (equivalent to 912,000 in a year). ↩
-
For more information about the Bloomberg-funded work in China between 2010 - 2014, see this factsheet (pp. 1, 6-7). We did find a single mention of a project conducted by the Global Road Safety Partnership between 2006 to 2009 (i.e., before Bloomberg funded any work in China). This project was limited to one (autonomous) province, and though it highlighted gaps in citizens’ knowledge of drunk driving laws, there’s no evidence to suggest this directly informed the change in national policy (Jia, 2015, p. 45). ↩
-
We also can’t rule out that Bloomberg involvement in non-legislative elements such as enforcement may have increased the impact of the 2011 amendment. ↩
-
We tried to determine whether this happened, but this is difficult given the limited documentation online from before 2011. One document that we did find is the product of a UN project to set regional and national road traffic casualty reduction targets, and although some initiatives in the Asia region reference drunk driving (United Nations, 2010, p. 60), China is noticeably absent from the list of member states and goals (pp. 62 - 64). However, this doesn’t rule out that the WHO influenced the legislation behind closed doors. ↩
-
The authors also mention improving healthcare, which we would expect to affect fatalities but not accidents. ↩
-
Comparisons over time should probably be taken with a pinch of salt, since this measure is subjective (as it’s measured by expert opinion) and relative (as ratings are compared to the “international standard,” which is a moving target). That being said, in 2008, China’s roads were ranked as 4.1 out of 7, and 51st in the world (World Economic Forum, 2008, p. 385). By 2015, the roads were ranked as 4.7 out of 7, and 42nd in the world (World Economic Forum, 2015, p. 367). ↩
-
On page 28, the authors write that there was a 37% increase in road casualties in 2001 compared to the year before, implying that this informed the 2001 law. However, this figure could not have been available yet when the law was passed in April 2001. We still think it is likely that the law was a reaction to an increase in road casualties. ↩
-
Some documents refer to it as the 2008 law, others as the 2007 law-change. As far as we can understand, it was passed in 2008 and came into effect officially in 2009, but it was preceded by a resolution in 2007 in which helmet wearing was already made mandatory. This is shown in more detail in Appendix A. ↩
-
United Nations, 2018, p.94. The report mentions two more programs which we have not looked into: “Global Actions on Harmful Drinking, funded by international alcohol industry members” and “Safe Routes for Youth, funded by Pernod Ricard.” ↩
-
One of Bloomberg’s activities between 2010 - 2015 as described here is “Reviewing the current road safety legislation and proposing appropriate amendments where necessary.” ↩
-
Since our main source for this paragraph is a report by the AIPF themselves (Goldman, 2018) which focuses on the work they have done, we think the impact of other organizations and focus areas (such as drunk driving) will be underrepresented in the examples given above. We do think it is credible that the impact of the AIPF has been large, and believe the examples given are valuable to understand ways for a philanthropic organization to have a positive impact. We also think the AIPF deserves more credit compared to Bloomberg for putting Road Safety on the agenda, since a lot was already going on regarding road safety in Vietnam when Bloomberg started working there in 2007. ↩
-
As measured by the Human Development Index, which includes factors such as life expectancy, education level and standard of living. We think this likely has a positive correlation with road and healthcare quality, and possibly vehicle standards. ↩
-
Specifically, the authors use a dummy variable to indicate the introduction of each law. For drunk driving, they consider the law to have been passed in 1995, despite explaining that enforcement was poor and the law was ineffective. Later on, after the BAC limit was amended, their data shows a reduction in deaths, but the authors don’t appear to model for the 2008 change specifically. This methodological choice is inconsistent with how the authors appear to have treated the helmet laws, where they consider the law to have passed in 2007, despite an ineffective law existing since 2001. ↩
-
In 2008, the roads were ranked as a 2.6 out of 7, and 102nd in the world (World Economic Forum, 2008, p. 385). By 2015, the roads were ranked as 3.3 out of 7, and 93rd in the world (World Economic Forum, 2015, p. 367). ↩
-
We did find that the ASEAN New Car Assessment Program was founded in December 2011 (Wong, 2015, slide 2), so this could have been a contributing factor around the same time drunk driving penalties were strengthened. However, given that most of Vietnam’s road users do not drive cars, we think this is likely to have had minimal effect. ↩
-
For research on safety effects from partly autonomous vehicles, we suggest looking into this ERSO (2018) report on advanced driver assistance systems. ↩
-
It’s worth noting that the 4.5% figure more accurately comes from Miller et al. (2018). Based on Hendrie et al.’s methodology, we believe that they use Miller et al.’s estimates directly, with no adjustments. ↩
-
We use GBD data in our model because we could not find Hendrie et al.’s baseline data. In our BOTEC, we try to determine how these sources might compare, and how this might impact our results. One datapoint suggests they should be the same, while a rough alternative calculation suggests it could increase our estimate of lives saved by 40%. This is worth keeping in mind when interpreting the results, but does not change our conclusions given the way our model is currently set up. ↩
-
It’s difficult to break down Bloomberg’s portfolio, but we provide more information about what we’ve found in a later section. To more accurately estimate costs of advocacy would also ideally incorporate spending by other organizations to speed up effective laws. ↩
-
For drunk driving, in many cases this is because the blood alcohol concentration limit for young drivers is not below 0.02 g/dl. ↩
-
Lua also noted that local governments may not have the capacity to implement the new laws. ↩
-
This method is clearly not perfect; it’s entirely possible that the snapshot that we happen to have is for a time when one nation has changed and others are still in the process of updating their laws to follow. ↩
-
There is clear heterogeneity for speed laws (particularly rural and highway laws) and drunk driving limits. There is less heterogeneity for the use of seatbelts for those in the front seat, but still significant variation for rear-seat passenger use. One region that seems to have more similar laws across all risk factors is Southern Africa, suggesting maybe there are spillovers (or regional lawmaking). ↩
-
We did not look into this, but here is a report on the economics of cycling by the Institute of Transportation & Development Policy. ↩
-
A report on lending between 2016 - 2018 suggests the majority of MDB-funded transport projects are focused on roads and urban transport (MDB Working Group on Sustainable Transport, 2019, p. 5). Therefore, we’d estimate that the relative investment in road safety elements versus specifically road sector investments is higher than 17%, but not higher than 30%. ↩
-
Our approach to this question was to search both Google and Google scholar, first with a focus on road safety and then with a broader focus on transport spending. We also checked the BOOST Open Budget Portal and the Aid Data portal, but did not find easily accessible relevant data. ↩
-
May not add up exactly due to rounding. $2.71 billion in the first row is the remainder of funding after we remove specific spending of which we are aware. ↩
-
Our starting point for subdividing this category was a 2014 World Bank report (p. 21) that details the breakdown of interventions by count. We then adjusted this based on input from Blair Turner, who suggested that a current breakdown based on spend would show a heavier emphasis on infrastructure safety engineering. Our resulting estimate should be treated as illustrative rather than accurate. ↩
-
This category includes “development of strategies, reviews of legislation, development of crash databases, institutional strengthening, and capacity building.” We were not able to break this down further. ↩
-
Road Safety Working Group, 2023, p. 2. ↩
-
Based on disbursements between 2018 - 2022, from GRSF (2022), p. 32. For more detail on GRSF spending, see Appendix E here. ↩
-
More detail on each of the rows can be found in Annex 2 of the report (pp. 40 - 53). This is where it becomes clear, for example, that DLI 2 is a result-based financing mechanism with full disbursement for a 30% reduction in annual traffic crash fatalities versus baseline. ↩
-
The relevant page for the Asian Development Bank contained limited detail as of June 2023. ↩
-
The program is a six-year program, as the previous phase ended on December 31, 2019. ↩
-
See the list of countries (and countries funded by BIGRS over time) in Appendix E. The list of cities is as follows: Accra (Ghana), Addis Ababa (Ethiopia), Bengaluru (India), Bogotá (Colombia), Buenos Aires (Argentina), Cali (Colombia), Campinas (Brazil), Chattogram (Bangladesh), Córdoba (Argentina), Delhi (India), Dhaka N. (Bangladesh), Guadalajara (Mexico), Guayaquil (Ecuador), Hanoi (Vietnam), Ho Chi Minh City (Vietnam), Kampala (Uganda), Kuala Lumpur (Malaysia), Kumasi (Ghana), Kyiv (Ukraine), Maharashtra (India), Mexico City (Mexico), Quito (Ecuador), Recife (Brazil), Salvador (Brazil), and São Paulo (Brazil). ↩
-
Nneka Henry of the United Nations Road Safety Fund (UNRSF) described the thematic focuses of BIGRS in 15 countries as speed and urban aspects of the road safety agenda. This is also reflected in the published materials of implementing partners like Vital Strategies and the GRSF. ↩
-
We could not find any details on the GHAI website. We looked at the 2022 annual report for the Campaign for Tobacco-Free Kids (because GHAI is one of their initiatives), but all we could learn is that BIGRS funding will be some part of the $36 million in grants income, and GHAI will be spending less on road safety than the $32 million recorded as spending on global programs (p. 36). We attempted to contact two members of the Vietnam team. ↩
-
Very roughly guessed based on 40% GRSP funding and 30% of Vital Strategies funding ($7 million overall) and an unknown amount of spending by GHAI. This seems likely to reach $10 million, which is 25% of the portfolio. ↩
-
We have significant uncertainty about this figure, and discuss this in Appendix E. When we asked Atsani Ariobowo of GRSP about total funding from Bloomberg, he directed us to the financial report. ↩
-
This was confirmed by Atsani Ariobowo (GRSP). A helpful graphic in the appendix illustrates the extent of the focus on advocacy at the national level. ↩
-
The UNRSF has five outcome areas. In decreasing order of disbursements by 2022, these are: Improved Behaviour of Road Users ($2.8m, 32%), Improved Safety of Road Infrastructure ($2.7m, 31%), Stronger Road Safety Management Capacity ($2.5m, 29%), Enhanced Safety of Vehicles ($0.5m, 6%) and Effective Post-crash Care Response ($0.16m, 2%). Spending on the final category has been prioritized for 2023. See UNRSF (2023). ↩
-
This tallies with what we can find about fundraising. For 2018 - 2023, UNRSF (2023) indicates that almost $30 million was raised for the six years (p. 14). This source is also where the percentage breakdown is from. For 2022 - 2025, a press release indicates new funding of $15 million as of June 2022 (UNRSF, 2022). ↩
-
UNRSF (2023) gives a detailed list of all projects, totaling thirty-six as of June 2023 (pp. 53 - 55). The list of eight newly selected projects for 2023 can be found here. Out of the 2023 list of projects, the most relevant focuses on safer speeds in school zones in Vietnam, and another focuses on implementing vehicle standards across 11 countries in Latin America and the Caribbean. The remaining 2023 projects focus on post-crash care (x3), data management (x1), and implementation (x2). ↩
-
The relevant sections of the annual reports can be found in FIA Foundation (2021), pp. 49 - 52, and FIA Foundation (2022), pp. 47 - 49. Both reports contain a list of grantees, though the geographic distribution of projects funded is not included. We have translated the numbers from ~€13m to ~$14m to be consistent with other numbers in this report. ↩
-
We also learned that they are a partner on a project in Cambodia that has just been selected to receive UNRSF funding (UNRSF, 2023, slide 6). ↩
-
All 15 countries are in the top 40 as measured by GBD DALY estimates. The list of countries over time can be found in Appendix E. ↩
-
Relevant countries only, we exclude the USA and Russia. ↩
-
Our uncertainty is greater because there is less evidence available, and we have reviewed what exists in less detail. Our model also does not account for the fact that the change in speeding legislation will differ by country; for example, in some countries advocacy might try to reduce speeds in urban areas by 10km/h, while in others it might aim to reduce speed by 30km/h. We assume the bar is at 1,500x, and take the average only for Top 25 countries who do not already have sufficient legislation. ↩
-
We don’t have any insight as to why Bloomberg stopped, though we did ask AIPF about this. ↩
-
Determined based on WHO interactive map of 2017/2018 laws (not available for Yemen and Algeria). Updated where indicated by the Country Captures report. Given recent legislative changes in Mexico, it’s possible that the laws are now sufficient. ↩
-
On page 28, the authors write that there was a 37% increase in road casualties in 2001 compared to the year before. This figure could not have been available yet when the law was passed in April 2001. We still think it is likely that the law was a reaction to an increase in road casualties. ↩
-
Following Resolution No. 32/2007/NQ-CP in 2007 (p.28) ↩
-
GRSP says it was in 2013: “In 2010, Bloomberg Philanthropies committed $125 million to 10 countries that represented half of road traffic-related deaths globally. [I]n 2013, Vietnam penalties were established for motorcyclists wearing helmets that failed to meet safety standards” (GRSP, 2015). ↩
-
Following the articles that the authors cite does not seem to lead us to the systematic review, but we think it’s likely the authors are referring to Miller and Levy (2000). We have not read this paper. ↩
-
To quote the authors: “Brazil authorized speed cameras but has installed almost none. Therefore, we attributed no fatality savings to this law… Russia eliminated its fines for travelling less than 20 km/h over the speed limit but raised fines at higher speeds. Bhalla et al. (2014) reported that the changes led to a rapid increase in speeding, which can be expected to increase velocity and associated mortality risks. We again attribute no fatality savings.” (Miller et al., 2021, p. 133) ↩
-
The meta-analysis is Castillo-Manzano and Castro-Nuño (2012), which includes limited data from middle income countries such as Brazil. The study in Botswana is Sebego et al. (2014), and indicates 11.5% initial impact. ↩
-
See an overview of GBD 2017’s road injuries methodology here. ↩
-
Police reports only attribute a death to a road accident if the injured person dies within seven days of the accident, which does not apply to death registration data. ↩
-
Approximately $1.8 trillion USD. ↩
-
For example, the law initially did not specify that the helmets had to be fastened; this was clarified in October 2008 (Passmore et al., 2010). ↩
-
Based on GRSP (2023), the total spend between 2012 (unknown start date) and April 2023 was $17.4m, or $17.4 / 11 = $1.6m per year. According to the organization’s 2020 Annual Report (pp. 25 - 26), the total awarded at the end of 2020 was $11.8m, meaning that $5.6m was allocated between January 2021 and April 2023. This suggests a more recent annual allocation of $5.6m / 2.25 years = $2.4m. ↩
-
The financial report actually says the money was received from Schwab, but we’ve made the assumption here that this is Bloomberg Philanthropies funding that’s being managed by Schwab. ↩